Wave Climatology of the Turkish Coast:
NATO TU-WAVES Project
A comprehensive project, called the NATO TU-WAVES Project, which aimed to find out the wave climate affecting the Turkish coast as well as the whole Black Sea region, was carried out during the period of 1994-2000 with generous financial support provided by the Science for Stability (SfS) Programme (Phase

Fig. 1: The Turkish Wave Gauging Network.

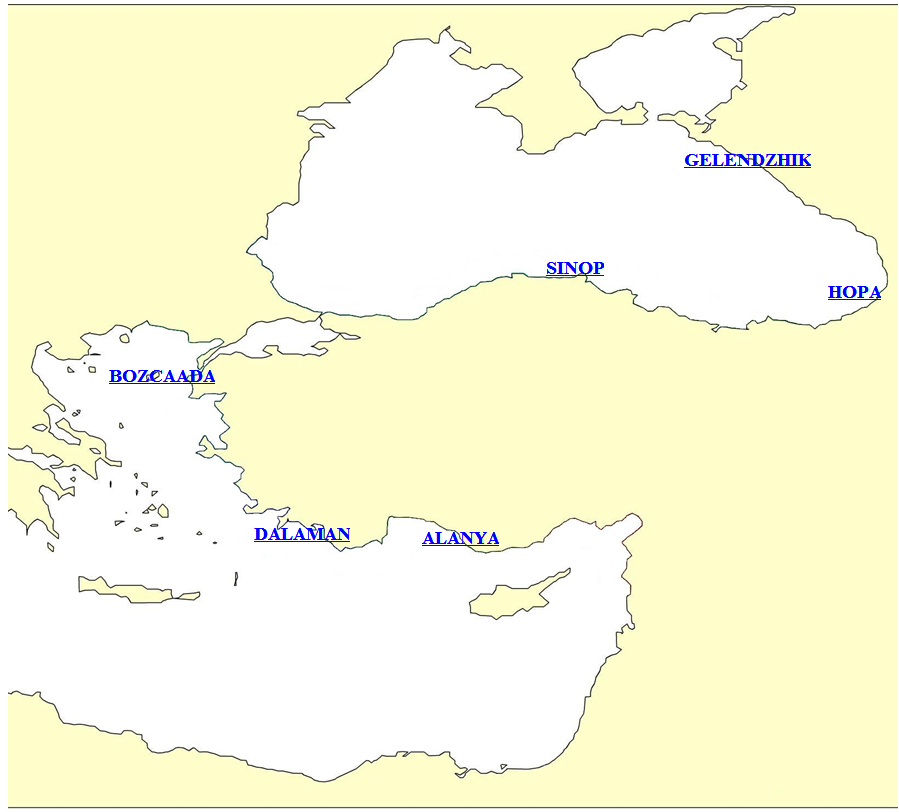
Fig. 2: The Black Sea Wave Gauging Network.
Measurements by Directional Waverider Buoy of Datawell
The Datawell directional waverider buoy was used for wave measurements of the NATO TU-WAVES Project at six stations. The buoy has a spherical shape with 0.9 m diameter and weighs 212 kg. It measures the directional wave spectra. It contains a heave-pitch-roll sensor, three axis fluxgate compass, two fixed x and y accelerometers, and a micro-processor. From the accelerations measured in the x and y directions of the moving buoy reference frame the accelerations along the fixed north and west axes are calculated. All three accelerations (vertical, north and west) are then digitally integrated to displacements and filtered to a high frequency cut-off (0.6 Hz). Finally, FFT is performed every 30 min. Raw data are compressed to motion vertical, motion north and motion west. Energy density, main direction, directional spread and the normalized second harmonic of the directional distribution for each frequency band (in addition to other sea-state parameters like the significant wave height, Hmo and mean wave period, Tz) are computed on-board (called processed data). Both raw and processed data are transmitted.
Description of the Published Data
The complete measured data sets obtained from the waverider buoys deployed at Alanya, Dalaman, Bozcaada, Sinop, Hopa and Gelendzhik are made published here. In Table 1, buoy location characteristics are given. Time series graphs of significant wave height, mean wave period and mean wave direction were prepared for periods of 10-11 days for each location are provided.
Click the station names in the maps below for access to the tables indicating the periods of data that are available for each location. By clicking on these periods, you can reach the time series graphs.
Acknowledgement requested
The measured wave data provided at this web site can be copied and used free of charge. The only condition (request) is to acknowledge Prof. Dr. Erdal Özhan of the Middle East Technical University, Ankara,Turkey, who was the Director of the NATO TU-WAVES, for providing the data, and the NATO Science for Stability Program for supporting the NATO TU-WAVES Project, whenever the data is utilized.
Table 1: Characteristics of the buoy locations.
|
Station |
Latitude |
Longitude |
Water depth (m.) |
Distance from shore (m.) |
|
Alanya |
36o 32' 30" N |
31o 58' 30" E |
100 |
1,400 |
|
Dalaman |
36o 41' 30" N |
28o 45' 18" E |
100 |
1,000 |
|
Bozcaada |
39o 42' 14" N |
26o 02' 57" E |
62 |
13,200 |
|
Sinop |
42o 07' 24" N |
35o 05' 12" E |
100 |
11,600 |
|
Hopa |
41o 25' 24" N |
41o 23' 00" E |
100 |
4,600 |
|
Gelendzhik |
44o 30' 27" N |
37o 58' 42" E |
85 |
7,000 |